
What the Inverted Yield Curve Is Telling Us About the Economy
Important Disclaimer: This article is for informational purposes only and does not constitute financial advice. This content covers topics that may significantly impact your finances. Always consult qualified financial advisors for advice specific to your situation.
The yield curve flipped upside down for 24 months straight, from July 2022 to August 2024, marking the longest inversion in modern history according to Equiti. Financial headlines screamed recession warnings. Economists debated whether this time was different. Investors scrambled to reposition portfolios.
Now the curve has normalized, sitting at a healthy 0.64% spread between 10-year and 2-year Treasury yields as of February 2026, per Advisor Perspectives. So what happened? And more importantly, what does the yield curve’s recent behavior actually tell us about where the economy is headed?
The inverted yield curve has been one of the most reliable recession predictors in financial history. But reliability and certainty are different things. Some experts remain skeptical, with Forbes noting that the inverted yield curve is “not necessarily” a reliable metric for predicting recession in every circumstance. Understanding what this signal means, how it works, and what to do with that information can help you make smarter financial decisions without overreacting to every headline.
Table of Contents
Toggle
- Key BenefitsPrimary AdvantagesUse Cases
- How It Works
- Getting Started
- Remember that all investments carry risk, and economic predictions remain inherently uncertain. Consider consulting a qualified financial advisor before making significant changes to your financial strategy based on yield curve or other economic signals.
Key Benefits
Primary Advantages
Understanding yield curve signals gives you a meaningful edge in financial planning. You gain early warning capability: historically, an inverted yield curve has preceded recessions by 7 to 24 months, according to The Daily Economy. That window provides time to adjust your approach before economic conditions deteriorate.
The yield curve also offers a free, publicly available data point that professional investors watch closely. You don’t need expensive research subscriptions or insider connections. Treasury yield data updates daily and reflects the collective wisdom of bond market participants managing trillions of dollars.
Perhaps most valuable is the perspective it provides. Rather than reacting to every scary headline or optimistic earnings report, you can anchor your economic outlook to a metric with a proven track record. The New York Federal Reserve currently assigns a 27% probability that the US will be in recession by September 2026, according to Current Market Valuation. That’s elevated but not alarming, suggesting caution rather than panic.
Use Cases
Individual investors can use yield curve data to inform asset allocation decisions. When the curve inverts, it may signal a time to reduce exposure to economically sensitive stocks and increase holdings in defensive sectors or high-quality bonds. Real Finance Tips recommends monitoring the 10-year minus 2-year spread monthly as part of your regular portfolio review.
Business owners benefit from yield curve awareness when planning capital expenditures. An inverted curve suggests borrowing costs may be elevated short-term while long-term economic conditions could weaken. That might mean delaying expansion plans or locking in longer-term financing while conditions remain favorable.
Homebuyers and those considering refinancing can use yield curve trends to time major financial decisions. The curve’s shape influences mortgage rates, and understanding the relationship helps you anticipate where rates might head in coming months.
How It Works
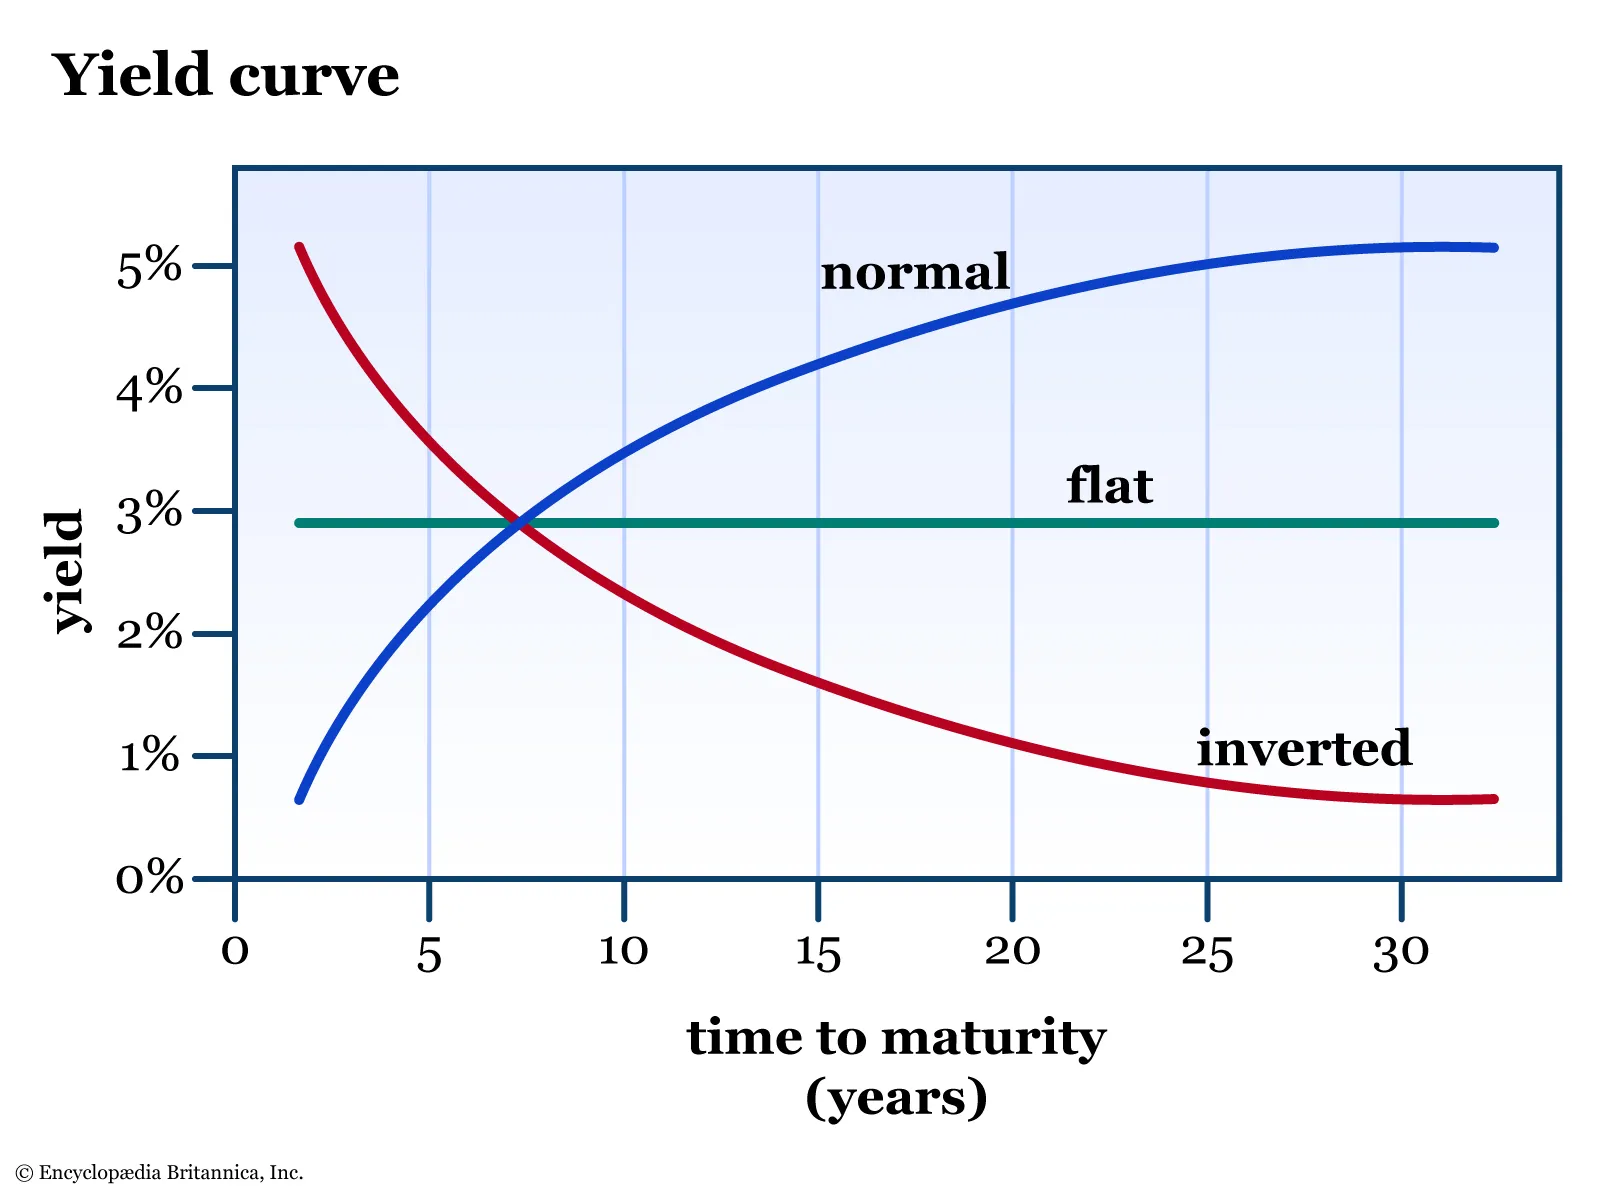
The yield curve plots interest rates across different bond maturities, typically from 3-month Treasury bills to 30-year Treasury bonds. Under normal conditions, longer-term bonds pay higher interest rates than shorter-term ones. This makes intuitive sense: lenders demand more compensation for tying up their money for longer periods with greater uncertainty.
An inversion occurs when short-term rates exceed long-term rates. This happens when investors expect the Federal Reserve to cut rates in the future, typically because they anticipate economic weakness. Bond buyers pile into longer-term securities, driving down long-term yields, while short-term rates remain elevated due to current Fed policy.
As of November 2025, the U.S. Treasury yield curve was upward sloping from 3.89% on 3-month bills to 4.12% on 10-year notes, according to Long Term Trends. This positive slope indicates markets expect relatively stable economic conditions ahead.
The Federal Funds Rate currently sits at 3.50% to 3.75%, per Financial Content. This represents significant easing from the peak rates that contributed to the prolonged inversion. Transamerica Asset Management forecasts the fed funds target range will reach 3.00% to 3.25% with a 10-year Treasury yield of 3.75% by the end of 2026, according to Transamerica.
Here’s the counterintuitive part that trips up many investors: Nasdaq notes that “the best recession signal comes when the yield curve stops being inverted.” The inversion itself warns of trouble ahead, but the un-inversion often coincides with the recession’s arrival or imminent approach. We’re in that post-inversion period now, which explains why recession probabilities remain elevated despite the curve’s normalization.
Getting Started
Building yield curve monitoring into your financial routine takes minimal effort but pays dividends in awareness. Start by bookmarking a reliable yield curve tracker. The St. Louis Fed’s FRED database offers free, updated data with historical charts. Check the 10-year minus 2-year spread weekly or monthly rather than daily: short-term fluctuations create noise that obscures meaningful signals.
Establish your baseline understanding of what different curve shapes mean:
- Steep positive slope (spread above 1%): Generally indicates economic optimism and expectations for growth
- Flat curve (spread near zero): Suggests uncertainty or transition, often preceding either acceleration or slowdown
- Inverted curve (negative spread): Historically associated with recession risk 7 to 24 months ahead
- Normalizing from inversion: The current situation, which warrants close attention
Real Finance Tips suggests creating a simple tracking spreadsheet to log monthly readings alongside your portfolio review. Over time, you’ll develop intuition for how yield curve changes correlate with economic conditions and market performance.
Consider how yield curve signals should inform, not dictate, your financial decisions. J.P. Morgan Asset Management expects the U.S. Treasury yield curve to be flat out to the 10-year maturity point at a sub-3% yield in 2026, according to J.P. Morgan. If that forecast proves accurate, it would suggest continued economic uncertainty through the year.
Avoid the temptation to make dramatic portfolio changes based solely on yield curve movements. This is one signal among many. Combine it with employment data, consumer spending trends, corporate earnings, and your personal financial situation. A diversified approach that acknowledges economic uncertainty without betting everything on one outcome serves most investors well.
For those seeking personalized guidance, consulting with a financial advisor can help translate yield curve signals into specific recommendations for your situation. Past performance doesn’t guarantee future results, and your individual circumstances matter more than any single economic indicator.
The yield curve’s 24-month inversion from 2022 to 2024 sent a clear warning signal that the economy faced headwinds. The subsequent normalization hasn’t eliminated recession risk: it may have actually moved us closer to the period when that risk materializes. With the New York Fed assigning a 27% recession probability through September 2026, prudent financial planning means acknowledging uncertainty while avoiding panic.
What the inverted yield curve tells us about the economy is nuanced. It’s neither a crystal ball nor a false alarm. It’s a tool that, combined with other indicators and professional guidance, can help you make informed decisions about saving, investing, and major purchases.
Real Finance Tips encourages you to add yield curve monitoring to your financial toolkit. Check the spread monthly, understand what changes mean, and use that knowledge to stay one step ahead of economic shifts. The investors who navigate uncertain times best are those who stay informed without overreacting.
Remember that all investments carry risk, and economic predictions remain inherently uncertain. Consider consulting a qualified financial advisor before making significant changes to your financial strategy based on yield curve or other economic signals.
This article is for informational purposes only and does not constitute financial advice.